Best for:
- Data processing
- Report generation
- Visual analytics
Use cases:
- Market trend analysis
- Sales data interpretation
- Customer behavior tracking
Users like:
- Business Intelligence
- Marketing
- Sales
What is AnalytiQA?
Quick Introduction
AnalytiQA is a versatile data analysis tool designed for business analysts, data scientists, and marketers.
Do you use AnalytiQA?
It enables users to process, analyze, and visualize data to make informed decisions.
TL:DR
- In-depth data processing.
- Interactive visualization features.
- Comprehensive reporting capabilities.
Features and Functionality:
- Data Processing Engine: Handles large datasets efficiently for real-time analysis.
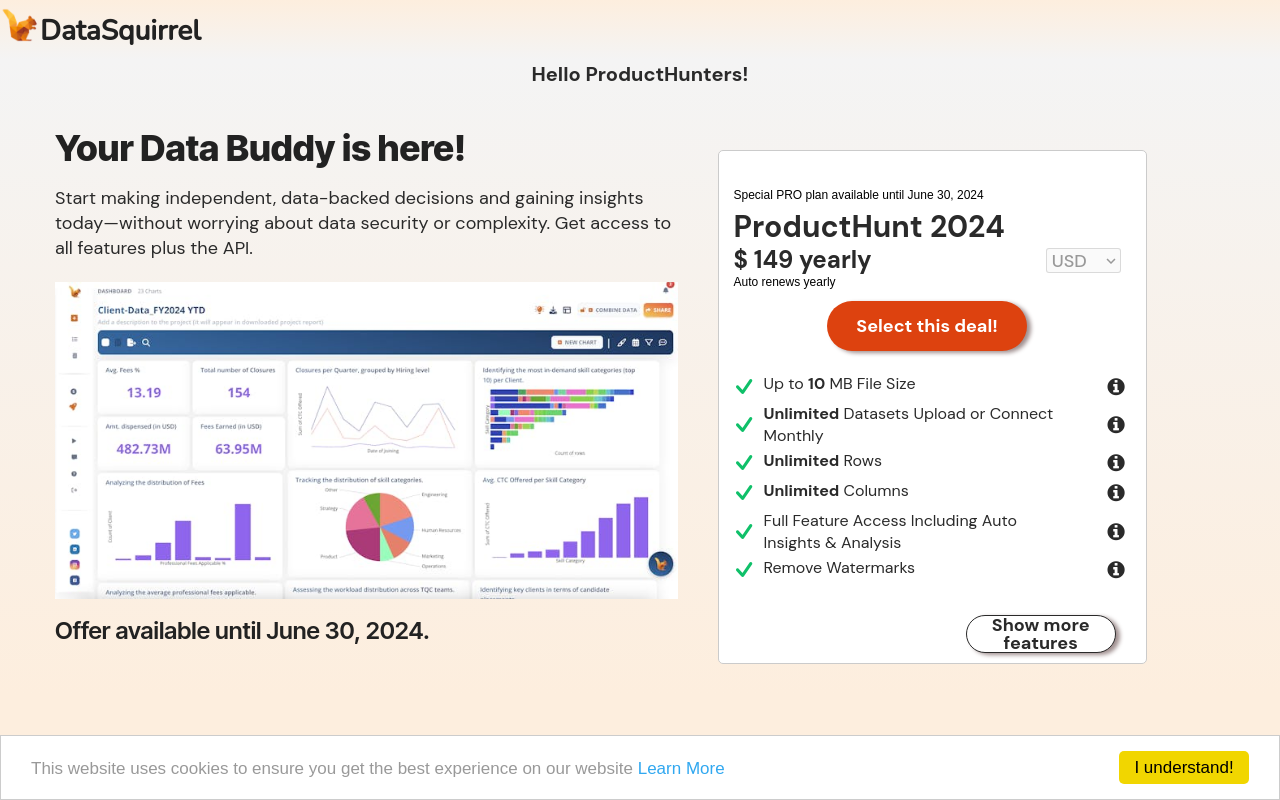
- Visualization Dashboard: Users can create dynamic charts and graphs.
- Automated Reporting: Generates detailed reports that can be scheduled and shared.
Integration and Compatibility:
AnalytiQA works standalone but can import data from CSV, Excel, and SQL databases.
Benefits and Advantages:
- Saves time on complex data tasks.
- Provides clear data insights through visual aids.
- Streamlines reporting and data sharing processes.
Pricing and Licensing:
Offers a tiered subscription model based on the features needed; free trial available.
Support and Resources:
24/7 customer service, extensive documentation, and a user community for peer support.
AnalytiQA as an alternative to:
Compared to Excel, AnalytiQA affords more advanced analytical features and interactive data visualization.
Alternatives to AnalytiQA:
- Tableau: Ideal for data visualization at an enterprise level.
- Google Data Studio: A free option for basic data analysis and reporting needs.
Conclusion:
AnalytiQA is a powerful and efficient tool for detailed data analysis and visualization suited for multiple professional environments.


