Best for:
- Data Visualization
- Business Intelligence
- Reporting
Use cases:
- Market Trend Analysis
- Sales Forecasting
- Customer Data Insights
Users like:
- Marketing
- Sales
- Product Management
What is AnalytiCool?
Quick Introduction
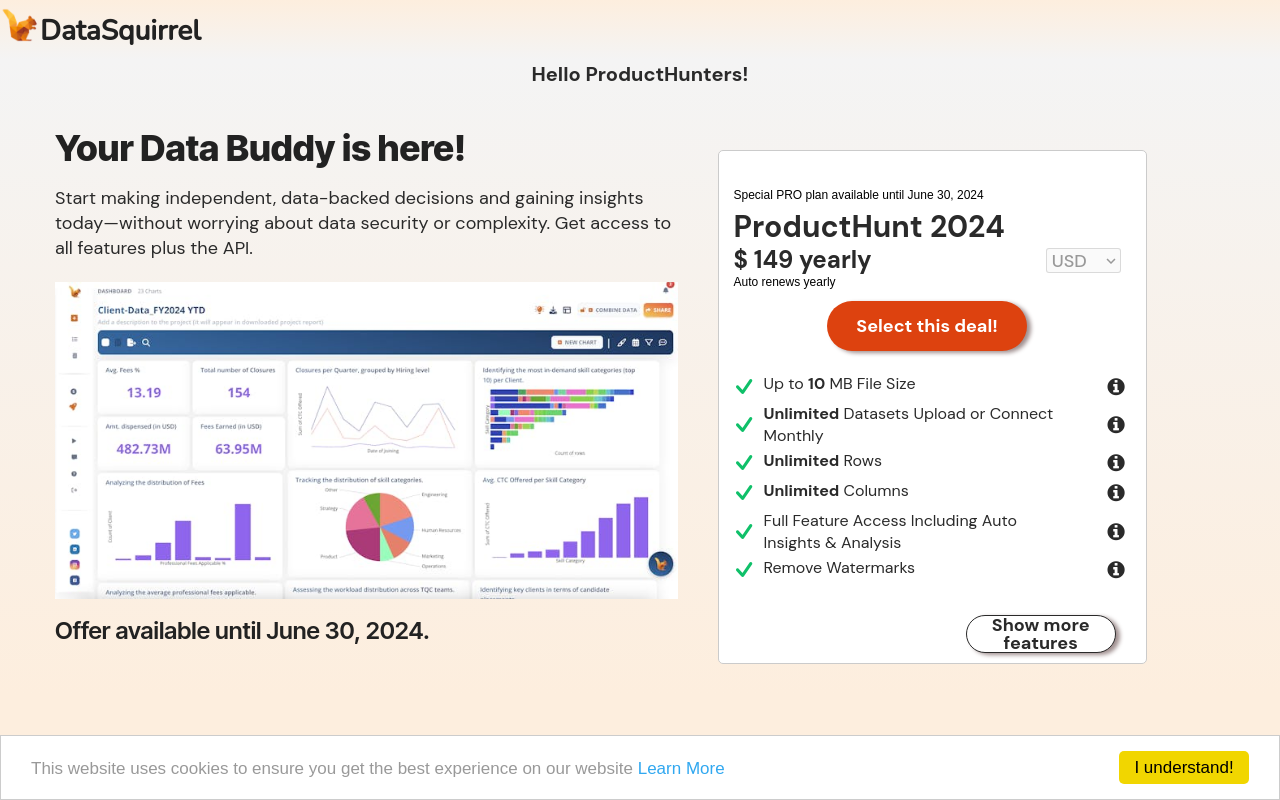
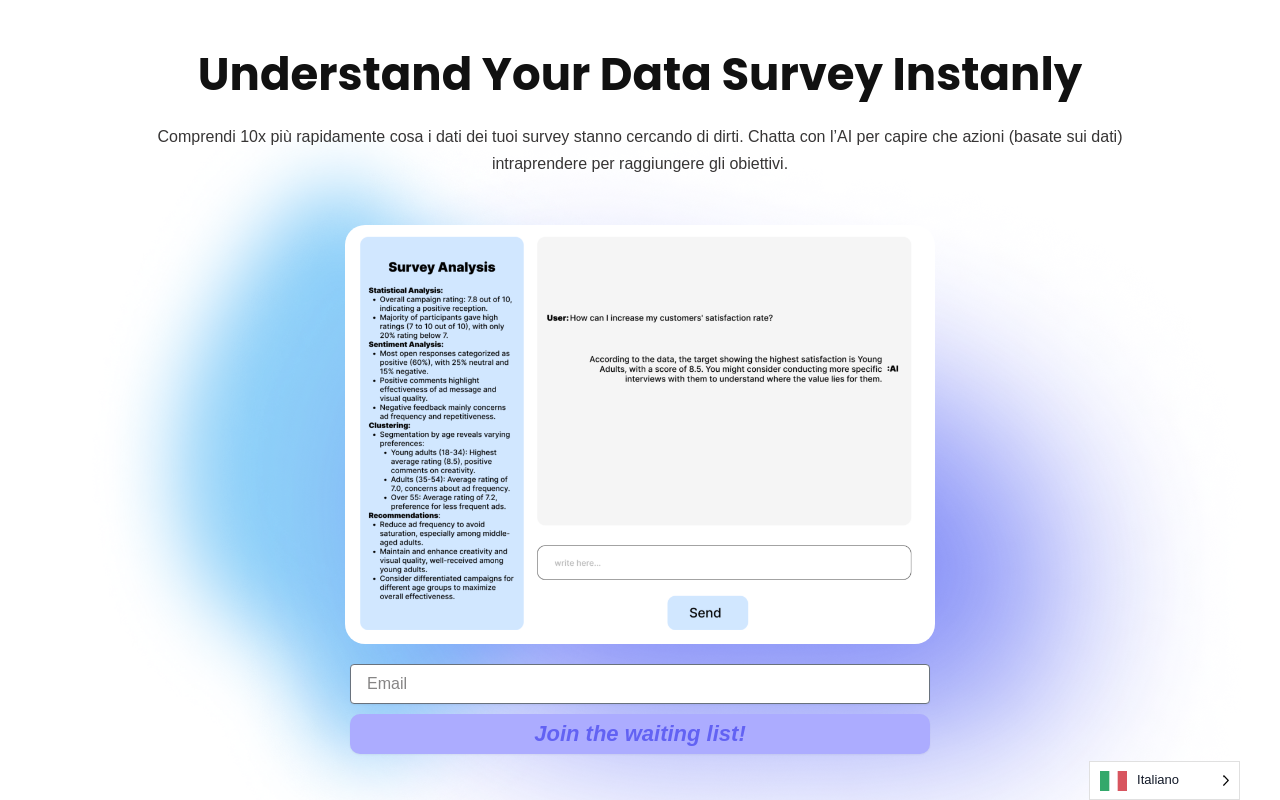
AnalytiCool is a data analysis platform designed for business users who need to make sense of large datasets and derive actionable insights. It’s tailored for managers, data analysts, and marketing teams looking to improve decision-making and understand customer behavior.
TL;DR
- Advanced data visualization tools.
- Customizable reporting capabilities.
- User-friendly interface with drag-and-drop features.
Overview
AnalytiCool makes handling data straightforward. Its main appeal is the simplicity it brings to data analysis, which often can be a complex task. The interface is clean and intuitive, allowing even those with minimal analytical experience to navigate and create reports.
Users can connect data from multiple sources, ensuring a comprehensive view of business performance.
Do you use AnalytiCool?
Interactive dashboards let users drill down into the specifics, making it easy to monitor key metrics and trends over time.
The customizable reporting feature helps in creating tailored reports that focus on what’s important for the business. Collaboration tools enable sharing insights across the team, enhancing collective decision-making.
Lastly, AnalytiCool’s support system is robust, offering tutorials and customer service to aid users in fully leveraging the tool’s capabilities.
Plans and Features
AnalytiCool offers a free trial, followed by a tiered subscription model. The basic plan covers essential features, while premium options include advanced analytics, greater customization, and more data source integrations.
Alternatives
Competitors like Tableau and Microsoft Power BI offer similar capabilities. AnalytiCool is a great alternative to more complex solutions like SAS Analytics or IBM Cognos, providing a more accessible entry point for small to medium-sized businesses.


